STANDARD DEVIATION CALCULATOR
How to find Standard Deviation?
Toolerz Standard Deviation Calculator is a free online tool that will calculate the standard deviation of a set of data.
What is Standard Deviation?
Standard deviation is a measure of how much variation or dispersion exists from the average (mean) of a set of values.
It helps in understanding the spread of data points and can indicate the consistency of data.
In simple terms, the smaller the standard deviation, the closer the data points are to the mean; a larger standard deviation indicates that the data points are spread out over a larger range of values.
How to Use the Standard Deviation Calculator
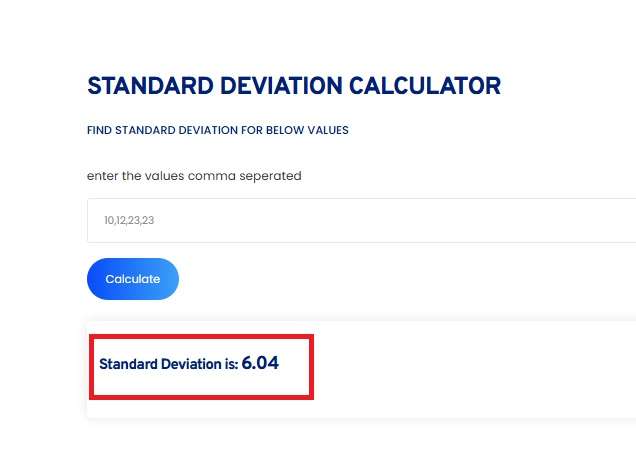
Using the Standard Deviation Calculator on toolerz.com is simple. Here’s a step-by-step guide:
Visit the Calculator: Go to www.toolerz.com and navigate to the Standard Deviation Calculator section.
Input Data:
You will see a text box where you can enter your dataset.
Input your numbers separated by commas, spaces, or line breaks.
Select Options:
You can choose if your dataset represents a sample or a population. This distinction is important since standard deviation can be calculated differently depending on whether you're using a sample or the entire population.
Calculate:
Click on the "Calculate" button, and the calculator will instantly display the standard deviation.
It will also show the mean, variance, and other relevant statistical metrics.
Functionality:
The Standard Deviation Calculator on toolerz.com is designed to handle both simple and complex datasets. Here are some of its main functionalities:
- Sample vs. Population: It differentiates between sample standard deviation (where N−1N-1 is used in the formula) and population standard deviation (where NN is used).
- Works with Frequency Distributions: You can input data as a frequency distribution, where each value is paired with how often it occurs, and the calculator will still compute the standard deviation.
- Handles Missing Data: If some data points are missing, the calculator can adjust its calculations to account for the lack of data.
- Works Offline: You can download a simplified version of the calculator for offline use.
For optimizing images, try our JPG Compressor to reduce file sizes without losing quality.
Benefits of Standard Deviation Calculator
standard deviation calculator is a handy tool that helps you quickly measure the spread or variability of a set of numbers.
Whether you're a student, teacher, or data analyst, this calculator saves time and removes the stress of doing complex math by hand.
It shows how much your data values differ from the average, helping you understand consistency and trends. For example, a low standard deviation means your data is closely grouped, while a high one shows more variation.
This is useful in fields like finance, science, education, and business decision-making. The calculator gives accurate results instantly, making it ideal for fast and reliable data analysis. It’s user-friendly and perfect for both beginners and
Key Features of Standard Deviation Calculator
The Standard Deviation Calculator is designed to simplify the process of calculating the standard deviation of a dataset, providing users with quick, accurate results.
One key feature is its ability to handle both sample and population data, allowing for flexible calculations depending on your needs.
The calculator is user-friendly, requiring only a list of numbers to generate the standard deviation. It automatically processes the data, ensuring error-free calculations, even for large datasets.
Additionally, it provides detailed results, including the mean, variance, and standard deviation, offering a comprehensive understanding of your data's spread.
Many calculators also feature a graphical representation of the data distribution, which aids in visual analysis. This tool is indispensable for students, analysts, and professionals, ensuring accuracy, speed, and ease when analyzing statistical data.
Calculating the Standard Deviation of 5, 5, 9, 9, 9, 10, 5, 10, 10
Let’s use the tool to calculate the standard deviation of the following dataset:
5,5,9,9,9,10,5,10,10
Step 1: Find the Mean
The mean is calculated by summing all the values and dividing by the number of values:
Mean=(5+5+9+9+9+10+5+10+10)/9 = 72/9 = 8
Step 2: Find the Differences from the Mean
Subtract the mean from each data point:
5−8=−3, 5−8=−3, 9−8=1, 9−8=1, 9−8=1, 10−8=2, 5−8=−3, 10−8=2, 10−8=2
Step 3: Square Each Difference
( − 3 ) 2 = 9 , ( − 3 ) 2 = 9 , ( 1 ) 2 = 1 , ( 1 ) 2 = 1 , ( 1 ) 2 = 1 , ( 2 ) 2 = 4 , ( − 3 ) 2 = 9 , ( 2 ) 2 = 4 , ( 2 ) 2 = 4
Step 4: Find the Mean of the Squared Differences
Variance=4.67
Step 5: Take the Square Root
The standard deviation of the dataset is approximately 2.16.
How to Calculate Standard Deviation Using Our Calculator?
To calculate standard deviation using our tool:
- Enter your data into the input box, separating each number with a comma.
- Select whether the data represents a sample or a population.
- Click on "Calculate" and the result, along with the mean, variance, and step-by-step explanation, will appear.
Standard Deviation Calculator Using Mean
Our Standard Deviation Calculator includes automatic mean calculation. When you input your data, the calculator not only computes the standard deviation but also displays the mean. This dual functionality makes it more efficient for users needing both results.
Standard Deviation Calculator with Table
One standout feature of our calculator is its ability to handle tabular data. If you have a dataset in a table format (e.g., a frequency distribution), you can input it directly, and the calculator will process the data accordingly, providing results for each row if necessary.
Standard Deviation Calculator with Steps
Understanding the calculation process is essential for users who want to learn. Our tool offers a “step-by-step” feature that breaks down the calculation process. Each stage of the calculation—from mean calculation to final standard deviation is explained clearly.
Why Do People Calculate Standard Deviation?
Standard deviation is a key statistical tool used to measure the amount of variation or spread in a set of data.
People calculate standard deviation to understand how consistent or spread out the values are from the average (mean).
A low standard deviation indicates that most data points are close to the mean, while a high standard deviation shows greater variability.
This calculation is especially helpful in fields like finance, research, education, and quality control.
For example, in investing, a lower standard deviation may signal a more stable stock, while in academics, it helps analyze student performance consistency.
By calculating standard deviation, people gain clearer insights into data trends, make informed decisions, and compare different data sets effectively.
It plays a vital role in ensuring accuracy, minimizing risk, and supporting data-driven conclusions.
Applications of Standard Deviation Calculator
The Standard Deviation Calculator is an essential tool for anyone working with data, whether in research, business, or education.
Its primary application is in measuring data variability, helping users understand how spread out the data points are from the mean.
In business, this tool is used to evaluate risk and volatility in financial markets, providing insights into market trends and investments. In education, it helps students and teachers analyze test scores and performance variations, making it easier to assess consistency.
The calculator is also valuable in quality control processes, where it helps assess product consistency and manufacturing reliability.
Researchers often use it to analyze experimental data, ensuring results are statistically significant.
By calculating the degree of dispersion, the Standard Deviation Calculator enhances decision-making and improves the accuracy of data interpretation across various fields.
While you're calculating standard deviation, you can also check out our BMI Calculator for health-related calculations.
Advantages of Standard Deviation Calculator
A Standard Deviation Calculator is an essential tool for anyone dealing with data analysis. It simplifies the process of calculating the standard deviation, a key measure of data spread or variability.
With just a few inputs, the calculator quickly provides accurate results, saving valuable time compared to manual calculations.
This tool ensures precision and eliminates the risk of human error, especially when handling large datasets.
For students, researchers, and professionals in fields like finance, healthcare, and engineering, the Standard Deviation Calculator enhances productivity by offering fast and reliable insights into data distribution.
Additionally, it helps users interpret data variability more effectively, aiding in decision-making and trend analysis. Whether analyzing test scores, stock prices, or manufacturing processes, this calculator proves to be an indispensable tool for clear and efficient data analysis.
Frequently Asked Questions
Q1: What’s the difference between sample and population standard deviation?
Ans: Population standard deviation is used when you have data for the entire group. Sample standard deviation is used when you only have a subset of the data.
Q2: Why should I use your Standard Deviation Calculator?
Ans: Our calculator is user-friendly, offers a step-by-step explanation, and is completely free. It is designed for both beginners and professionals who need quick and accurate results.
Q3: Can I use the calculator for large datasets?
Ans: Yes, our tool supports both small and large datasets, allowing you to compute standard deviation for extensive data entries with ease.
Q4: How does the calculator ensure accuracy?
Ans: It uses precise algorithms to compute the mean, variance, and standard deviation, with the option to view the steps for transparency.
Q5: Does the calculator provide the mean as well?
Ans: Yes, in addition to standard deviation, it automatically calculates and displays the mean for your data set.
Q6: What other statistics does the calculator offer?
Ans: Besides standard deviation and mean, it also calculates the variance, showing how the data points spread from the mean.
Q7: Can I calculate standard deviation for grouped data or frequency distributions?
Ans: Yes, the calculator can handle frequency distributions. You can input data in tabular format and receive accurate results.
Q8: Is the tool mobile-friendly?
Ans: Yes, our Standard Deviation Calculator is fully optimized for mobile devices, so you can use it on the go.
Q9: Is the calculator suitable for educational purposes?
Ans: Yes, Students and teachers can use the tool to better understand the concept of standard deviation with detailed explanations and breakdowns of each calculation step.
Q10: How do I enter my data?
Ans: You can input data separated by commas, spaces, or line breaks. You can also paste tabular data for frequency distributions.
Q11: Can I use the calculator offline?
Ans: Yes, we offer a downloadable version of the calculator for offline use, allowing you to calculate standard deviation without an internet connection.
Q12: What is the difference between variance and standard deviation?
Ans: Variance is the average of the squared differences from the mean, while standard deviation is the square root of the variance.
Q13: How secure is my data when using the calculator?
Ans: Your privacy is important to us. We do not store or save any data you input, ensuring full confidentiality.
Q14: What are the applications of standard deviation?
Ans: Standard deviation is widely used in finance, education, science, quality control, and more to measure variability and make informed decisions.
Q15: What is standard deviation?
Ans: A measure of the dispersion or spread of data points from the mean in a data set. It shows how much individual data points differ from the average.
Q16: Why is Standard Deviation important?
Ans: Standard deviation helps you understand the spread of your data. A low standard deviation means the data points are close to the mean, while a high standard deviation indicates the values are spread out. It’s commonly used in finance, science, and statistics.
Q17: Is the standard deviation calculator free to use?
Ans: Yes, it is completely free. You can use it as often as you like without any sign-up or downloads.https://www.toolerz.com/
Q18: Can I use the calculator for both population and sample data?
Ans: Yes, most standard deviation calculators let you choose between population and sample. Just select the correct option based on your data type.
Q19: Do I need to be an expert to use the Standard Deviation Calculator?
Ans: No, you don’t need to be an expert. The Standard Deviation Calculator is user-friendly, and you can get the results with just a few clicks. It’s a great tool for anyone who wants to understand data distribution without performing complex calculations manually.
Q20: Who can benefit from using a Standard Deviation Calculator?
Ans: Students, researchers, data analysts, and anyone working with statistics can benefit from using a Standard Deviation Calculator. It’s especially useful for analyzing the consistency or variability of data.
Q21: What kind of data can I use with this calculator?
Ans: You can use any set of numbers like test scores, daily temperatures, or sales figures—basically any data where you want to measure variation.