STATISTICS CALCULATOR
What is Toolerz Statistics Calculator?
A Statistics Calculator is a tool designed to perform a wide range of statistical calculations. It simplifies complex statistical tasks by quickly generating important metrics such as mean, median, mode, standard deviation, variance, and more.
These tools are essential for data analysis and interpretation, helping users to derive meaningful insights from raw data.
Our Statistics Calculator not only computes basic statistical values but also supports more advanced operations, such as hypothesis testing, regression analysis, and correlation calculations.
How to Use?
Using our Statistics Calculator is very simple. Here’s a step-by-step guide on how to get started:
Step 1: Input Your Data
Visit www.toolerz.com and navigate to the Statistics Calculator.
Enter your dataset into the provided input field. You can separate values by commas, spaces, or line breaks.
Step 2: Select the Type of Calculation
Choose from various statistical operations. You can select multiple calculations at once or perform them one by one. For instance, if you want to find the mean, median, and mode of a dataset, simply check those options.
Step 3: Press "Calculate"
Once you've input your data and selected the desired calculations, click on the "Calculate" button. The results will be displayed within seconds.
Step 4: Review the Results
The calculated values for your selected operations will appear on the results screen. If needed, you can adjust your input and recalculate.
Benefits of Statistics Calculator
A Statistics Calculator offers numerous advantages for students, professionals, and anyone dealing with data analysis.
One of the key benefits is time-saving, as it quickly computes complex statistical values like mean, median, mode, standard deviation, and variance, eliminating the need for manual calculations.
This tool is particularly useful for those who need to analyze large datasets, ensuring accuracy and precision in results. It simplifies data interpretation, making it easier to understand patterns and trends, which is essential for informed decision-making.
The calculator also supports a variety of statistical functions, making it ideal for fields like research, finance, and quality control.
Additionally, it helps reduce human errors, providing reliable results in both academic and professional settings.
Whether for academic studies or real-world applications, the Statistics Calculator enhances efficiency and accuracy, making data analysis much more manageable.
Functionality
Our Statistics Calculator performs the following statistical functions:
- Descriptive Statistics: These include measures of central tendency (mean, median, mode), dispersion (standard deviation, variance, range), and shape (skewness, kurtosis).
- Inferential Statistics: You can perform hypothesis tests (t-tests, chi-square tests) and calculate confidence intervals.
- Probability Distributions: It allows for the analysis of probability distributions like normal, binomial, and Poisson distributions.
- Regression and Correlation: This feature helps in determining relationships between variables and predicting outcomes based on datasets.
For financial planning, check out our SIP Calculator to estimate your investment returns effortlessly.
Sample Statistics Calculation Using Our Tool
Let’s walk through an example using the tool: www.toolerz.com
Example 1: Calculating Mean, Median, and Mode
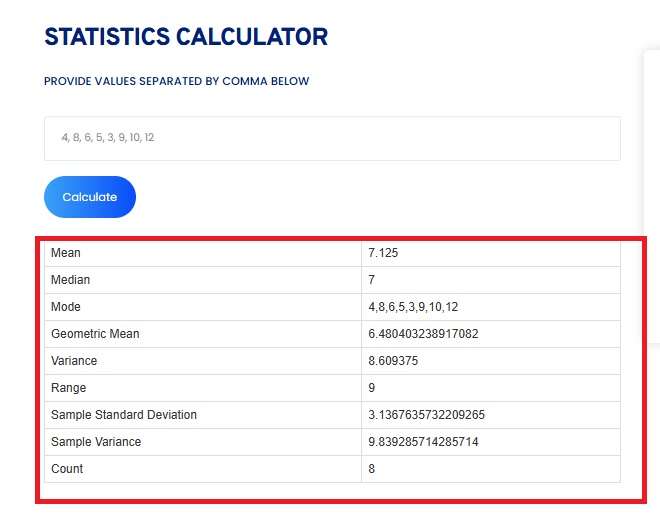
Given the dataset: 4, 8, 6, 5, 3, 9, 10, 12
- Mean: The sum of the values divided by the number of values. (4+8+6+5+3+9+10+12) / 8 = 7.125
- Median: The middle value when the numbers are arranged in order. (6+8)/2 = 7
- Mode: The number that appears most frequently in a dataset. In this case, there is no mode as all numbers appear once.
By inputting this dataset into the calculator, you will quickly receive these results.
How to Calculate Statistical Values Manually
Although our calculator automates the process, it's useful to know how to calculate some basic statistics manually:
Mean: Sum of all numbers divided by the count of numbers.
Formula: Mean=ΣX/N
Where ΣX is the sum of all data points and is the number of data points.
Median: The middle number in a sorted dataset. If the dataset has an even number of values, the median is the average of the two middle numbers.
Mode: The number that appears most frequently in a dataset.
Variance: Measures how far the numbers in the dataset are spread out.
Formula: Variance=Σ(X−μ)2/N
Where μ is the mean of the dataset.
Standard Deviation: The square root of the variance.
Formula: Standard Deviation=Square root of Variance
Types of Statistics Calculators
Inference, regression, and statistical tests calculators are powerful tools designed to simplify data analysis. Whether you're a student, researcher, or data enthusiast, these calculators help you draw meaningful conclusions from data with ease.
Inference calculators assist in estimating population parameters based on sample data. Regression calculators are used to find relationships between variables, making predictions more accurate and data-driven.
Statistical tests calculators, such as t-tests or chi-square tests, help determine if your results are significant or just due to chance. These tools save time, reduce manual errors, and offer step-by-step outputs to make statistics easier to understand.
Perfect for academic work or real-world problem-solving, they bring clarity to complex numbers. Use these free, user-friendly calculators to make smart, data-backed decisions in just a few clicks.
What Does Sx Mean on a Calculator?
On a scientific calculator, Sx (or sometimes written as Σx) typically represents the sum of all x-values in a data set.
This function is commonly used in statistics mode when working with a list of numbers. It helps users quickly find the total of all values entered, which is useful for calculating averages, standard deviations, and other statistical measures.
For example, if you enter the numbers 5, 10, and 15 into the calculator, the Sx will show 30 (because 5 + 10 + 15 = 30). It’s a part of the calculator’s built-in statistical functions that allow for faster data analysis without needing manual calculations.
Understanding terms like Sx is important when using your calculator for exams, data analysis, or financial planning. Always refer to your calculator's manual for exact functionality, as terms can vary slightly across models.
Types of Statistics Calculators
Our Statistics Calculator can perform various types of calculations, including:
- Descriptive Statistics Calculator: Provides summaries such as mean, median, mode, and range.
- Variance and Standard Deviation Calculator: Calculates how much variation or dispersion exists in a dataset.
- Correlation Calculator: Measures the strength and direction of a linear relationship between two variables.
- Regression Calculator: Predicts the value of a dependent variable based on the value of an independent variable.
- Probability Calculator: Computes probabilities using different distributions (normal, binomial, Poisson).
- Hypothesis Testing Calculator: Performs tests like t-tests, z-tests, chi-square tests to make inferences about population parameters.
Applications of Statistics Calculator
The Statistics Calculator is a powerful tool with various applications across different fields. In education, it helps students and educators quickly calculate mean, median, mode, variance, and standard deviation, simplifying complex statistical problems.
Researchers use it to analyze data, perform hypothesis testing, and evaluate statistical significance, speeding up data analysis and enhancing accuracy.
For business analysts, it aids in market research, helping to interpret data sets, identify trends, and make informed decisions.
In healthcare, the calculator is utilized to analyze clinical data, conduct epidemiological studies, and assess risk factors.
Additionally, data scientists and statisticians rely on it to process large data sets efficiently. Whether for personal use, academic purposes, or professional analysis, the Statistics Calculator is an essential tool for simplifying statistical computations and improving data interpretation.
Examples of Using the Statistics Calculator
Example 2: Hypothesis Testing
Suppose you're testing whether a new teaching method is more effective than the old one. You collect test scores from students and input the data into our calculator for a t-test. The tool provides a p-value, helping you determine whether the difference in scores is statistically significant.
Example 3: Probability Distribution
You’re analyzing the likelihood of an event occurring in a binomial setting, say the success rate of a marketing campaign. Input the number of trials and the success probability, and our calculator will give you the probability distribution.
Advantages of Statistics Calculator
A Statistics Calculator offers numerous advantages, making complex statistical analysis quick and accessible.
It simplifies the process of calculating critical statistical measures such as mean, median, standard deviation, and variance, saving time and effort.
For students and professionals alike, it helps eliminate manual errors and ensures accuracy in calculations. It is especially valuable for those who need to process large data sets, as it can handle complex computations that would otherwise be tedious by hand.
Additionally, this tool enables users to interpret and visualize data more effectively, supporting better decision-making in fields like business, healthcare, and research.
By offering easy-to-use interfaces and immediate results, the Statistics Calculator empowers users to focus more on data insights and less on the intricacies of computation, improving productivity and efficiency.
While you're working with statistics, you may also find our Investment Calculator useful for calculating returns on your investments.
Frequently Asked Questions
Q1. Can I use the calculator for large datasets?
Ans: Yes, our calculator supports large datasets with thousands of data points without compromising speed or accuracy.
Q2. Is the Statistics Calculator compatible with mobile devices?
Ans: Yes, The tool is optimized for mobile and desktop use.
Q3. What formats can I input data in?
Ans: You can input data in comma-separated values, spaces, or line breaks.
Q4. Does it support hypothesis testing?
Ans: Yes, the tool can perform various hypothesis tests like t-tests, z-tests, and chi-square tests.
Q5. Can I calculate regression using this tool?
Ans: Yes, our calculator supports both simple and multiple regression analysis.
Q6. Is the Statistics Calculator free?
Ans: Yes, the tool is 100% free to use with no hidden costs.
Q7. Does it calculate z-scores and t-scores?
Ans: Yes, both z-scores and t-scores are supported by our tool.
Q8. Can I use it to calculate probabilities?
Ans: Yes, you can calculate probabilities for various distributions, including normal and binomial.
Q9. How can a Statistics Calculator help me?
Ans: A Statistics Calculator simplifies complex calculations by providing instant results. It is useful for students, researchers, and professionals who need to analyze data for reports, projects, or studies.
Q10. Do I need to download software to use a Statistics Calculator?
Ans: No, most Statistics Calculators are available online and work directly in your browser. You don’t need to download or install anything.
Q11. Is it accurate to rely on a Statistics Calculator?
Ans: Yes, Statistics Calculators use standardized formulas to deliver accurate results. As long as you enter the correct data, the calculator will provide precise calculations.
Q12. Can beginners use a statistics calculator?
Ans: Absolutely! The tool is designed to be user-friendly. Even if you’re new to statistics, you can use it easily by entering your numbers and selecting what you need.
Q13. What types of problems can I solve with a statistics calculator?
Ans: You can use it to calculate average, range, variance, percentiles, and standard deviation. Some calculators also support advanced topics like regression and probability.
Q14. Do I need to be an expert in statistics to use this tool?
Ans: No, you do not need to be an expert. The Statistics Calculator is designed to be user-friendly. You only need to input your data, and the tool will provide the results. However, it’s useful to have a basic understanding of the statistics being calculated to interpret the results effectively.
Q15. What is a Statistics Calculator?
Ans:A Statistics Calculator is an online tool that helps you perform various statistical calculations. It can calculate mean, median, mode, standard deviation, variance, and other important statistical measures from a set of data.
Q16. What statistical results can I get from this calculator?
Ans:Most calculators provide values like mean (average), median (middle number), mode (most frequent number), range, variance, and standard deviation.